
Stefan Shaffer, our New York Partner, shares the latest Private Capital Report for October 2022. Overall, liquidity conditions in the private market have changed considerably in Q4. The precipitous increase in the cost of capital is matched by a corresponding contraction in leverage multiples. Read the full report below.
Private Market Is Solidly in “Risk-off” Mode
We are making comprehensive modifications to its pricing and leverage metrics for October. In fact, this month’s credit spreads and leverage multiple adjustments represent the most prohibitive single-month revisions to the update in more than 10 years. There is little doubt that the private market is solidly in “risk-off” mode, as institutional lenders dance the “Back Off Boogaloo.”
We are increasing credit spreads across the board this month by a minimum of 50 basis points for the highest quality senior bank debt, 100 – 200 basis points for non-bank senior debt and unitranche facilities, and up to 300 basis points for subordinated debt. While the recent spike in credit spreads is striking, taken in combination with the unprecedented rise in the underlying SOFR base rates (SOFR was .05% in January, and 3.05% as of October 11th), the delta in an issuer’s cost of capital from Q1 and Q4 2022 is nothing short of draconian.
Higher Cost of Capital Means Tighter Fixed Charge Coverage Ratios
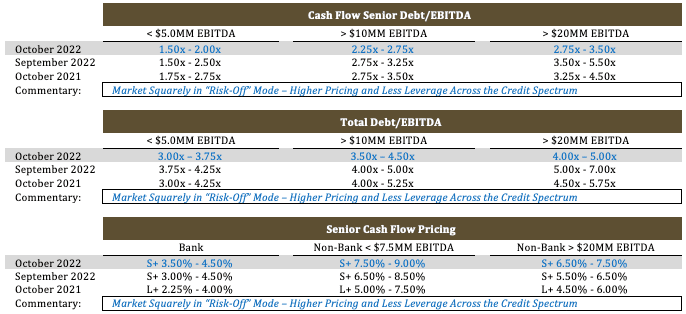
Not surprisingly, the precipitous increase in the cost of capital is matched by a corresponding contraction in leverage multiples (ranging ~0.50x – 1.50x turns of EBITDA). After all, the higher cost of capital translates to tighter fixed charge coverage ratios and given the current anemic expectations for future macroeconomic growth (or potentially, recession) in 2023, lenders are understandably reticent to consider stretching their leverage tolerances. While most commercial banks still reference the “3/4 Box” (i.e., 3.0x senior debt by 4.0x total debt) for most lower middle market issuers, the “box” has devolved into a “2.5/4.0 Box.”
SPP’s anecdotal experience is consistent with this transition, as commercial banks are rarely stretching to 3.0x senior debt for cash flow loans, defaulting to a range between 2.00x – 2.50x for issuers with less than $10 million in LTM EBITDA, and 2.25x –2.75x for issuers with less than $20 million in LTM EBITDA. Generally, for issuers to gain more than 3.0x senior debt, a minimum of $25 million in LTM EBITDA is required.
There is ample support for the current bearish perspective in the private credit markets. The September non-farm payrolls report was strong and narrowly missed analyst expectations, almost guaranteeing another 0.75% increase in the fed funds rate at the November FOMC meeting (which will also push SOFR rates higher). Institutional lenders continue to question the Fed’s capacity to engineer a “soft-landing,” and expectations for a sustained credit downcycle have become the norm. In September, North American corporate debt downgrades accelerated and tripled the number of corresponding upgrades.
Deal Activity Slowed in H2 2022
The more challenging issuance environment has produced two unique consequences in the private capital markets. First off, deal activity has fallen off a cliff. As noted by Prequin, “Private debt deal activity in North America has slowed in the second half of 2022 so far, with the number of deals dropping to just over 100 in Q3 this year. Since the recent high of $78.8 billion in Q2 2021, aggregate deal value has fluctuated, averaging $42.7 billion per quarter. In Q3 2022 aggregate deal value registered only $12.1 billion.” Similarly, Debtwire Par reports that institutional leveraged loan issuance plummeted 68% from the same period last year, and in the third quarter, institutional loan issuance totaled just $28.6 billion, roughly half of the $52.1 billion in volume seen in January of 2022 alone.
Another unique shift developing in the private market are the dynamics and disparities evolving between the non-bank unitranche lending community and traditional bifurcated senior/sub tranche lending constituencies. For the last five years (when LIBOR, then SOFR) ranged between 0.00% – 0.25%, non-bank direct lenders largely disintermediated the traditional bifurcated senior/sub structures. Assuming a scenario for a $10 million EBITDA issuer seeking 4.0x leverage, a 3.0x (L + 3.0%) leverage bank deal combined with a 1.0x leverage of sub debt (12.0% fixed rate) was virtually identical in cost to a 4.0x unitranche facility priced at S + 6.00%. Given that fact that the non-bank lending community typically required minimal amortization (~1.00% – 2.50% amortization per annum) and could generally provide significantly more flexible and expansive covenants, non-bank unitranche providers would often prevail against their bifurcated counterparts. However, with SOFR now over 3.0%, and with average unitranche pricing at S + 7.00% for most middle market issuers, the balance is shifting back toward senior/sub structures. Using the same example above, (a $10 million EBITDA issuer and a 3.0x/4.0x senior/sub structure vs a 4.0x unitranche structure), the cost comparison has shifted largely in favor of the bifurcated senior/sub structure due to a cheaper blended cost of capital (8.38% vs. 10.05%). Even with a more conservative bank case of 2.5x/4.0x, the cost savings of a bifurcated deal is still ~100 basis points lower than a comparable unitranche. While unitranche providers still offer significantly lower required amortization, and generally more flexible covenant restrictions, it is becoming increasingly difficult for issuers to swallow “senior” debt at a blended cost of capital in excess of 10.0%.
It will be interesting to see how the dynamics of different lending constituencies conform and compete in this less hospitable credit environment, but for the time being, expect most lenders to continue practicing their best Back Off Boogaloo.
Tone of the Market
Liquidity conditions in the private market have changed considerably in Q4. Credit spreads, on average, have spiked 50 – 100 basis points for commercial bank lenders, while non-bank direct credit funds have increased spreads by 100 – 300 basis points. Earlier in 2022, smaller, more storied issuers were disproportionately impacted by spikes in credit spreads. However, recent hikes in credit spreads are impacting even the highest credit quality issuers. Higher capital costs translate to tighter fixed charge coverage ratios, and not surprisingly, risk conscious credit providers have tightened leverage multiples as well – on average 1/2 turn to as much as 1.5 turns of EBITDA across the credit spectrum. This markedly less hospitable credit environment manifests itself beyond simple pricing and leverage metrics; issuers in Q4 can also anticipate heighted covenant scrutiny, less favorable add-backs to “Adjusted EBITDA” definitions, and in some cases re-trading of material deal terms prior to final committee approval. Several investor constituencies have erected “no-fly” zones for more volatile and cyclical sectors including apparel, restaurants, construction, and discretionary consumer products. Use of proceeds will also have a profound influence on issuance with investors increasingly intolerant respecting non-accretive uses such as share purchase and dividend recapitalizations.
Minimum Equity Contribution
Minimum equity contribution levels required in leveraged buyouts have remained relatively consistent since 2017, ranging from a low of 44.5% in 2018 to a high of 44.8% in 2021. As a general proposition, lenders remain wary of thinly capitalized deals and that is especially true for 2021 vintage financings where enterprise multiples were elevated. Minimum aggregate base level equity of 50% (inclusive of any rollover) is likely required for most deals, with at least 30%-35% minimum new cash equity. The market remains relatively tolerant of “structured-equity” solutions below the debt stack, including cash-pay (or cash/PIK) preferred structures between the debt and common shares.
Equity Investment and Co-Investment
Liquidity for both direct equity investment and co-investment continues unabated. Whereas opportunities for equity co-investment historically were limited by most traditional lenders or relegated to a small percentage of their aggregate debt commitment, interest in equity co-investment has boomed. In most cases, the ability to offer an equity co-investment (and the accompanying “upside” equity potential) will generate lower all-in borrowing costs, enhanced amortization flexibility, and more robust adjustments to EBITDA. Interest in independently sponsored deals also continues unabated, especially in those cases where an independent has secured an LOI at “value” pricing. Family offices are still the best source of straight common equity, and, continuing the trend established in 2020, credit opportunity funds, insurance companies, BDCs, and SBICs will actively pursue providing both debt and equity tranches.
*Securities offered through SPP Capital Partners, LLC: 550 5th Ave., 12th Floor, New York, NY 10036. Member FINRA/SIPC

Stefan Shaffer
Managing Partner and Principal
Stefan has over 30 years of experience in the private market includes hundreds of transactions in North America, Asia and Europe. Prior to becoming a principal at SPP Capital, Stefan was a Vice President in the Private Placement Group at Bankers Trust Company where he was responsible for origination, structuring and pricing of private placements for the Capital Markets Group, both nationally and internationally.
[email protected]
Ph: +1 212 455 4502