
Stefan Shaffer shares the latest US Private Capital Report for May 2023. The private credit markets are evolving and increasingly playing host to both larger issuers and global credit funds that have historically transacted in the 144A, public, and syndicated loan markets. As this transition has unfolded, transaction activity has increased in the private credit markets, while deal flow in the syndicated and 144A markets has correspondingly declined. Read the full report below.
The Private Credit Markets Are Evolving
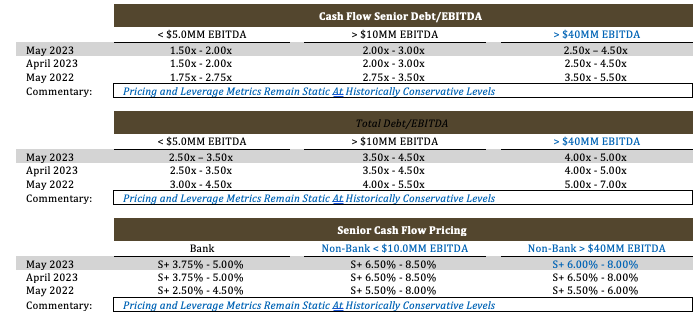
We are making a few seemingly minor, but actually quite significant, changes to our Market-At-A-Glance Metrics for the month of May. First and foremost, we are increasing the threshold for larger middle market issuers from >$20 million to >$40 million, recognizing that pricing and leverage metrics for mid-middle market issuers really do not materially change between a $15 million EBITDA issuer and a $25 million issuer (one will simply be at the lower end of the range and one at the higher end). However, metrics do shift markedly between a $25 million EBITDA issuer and a $45 million EBITDA issuer.
This modification to our metric measurement is also a tacit acknowledgment that the private credit markets are evolving and increasingly playing host to both larger issuers and global credit funds that have historically transacted in the 144A, public, and syndicated loan markets. As this transition has unfolded, transaction activity has increased in the private credit markets, while deal flow in the syndicated and 144A markets has correspondingly declined. While the longer-term effects of this evolution to a larger, more crowded private market have yet to be seen, one immediate effect is that pricing for larger deals is becoming slightly more competitive. Accordingly, the second modification to our May metrics is to tighten pricing for non-bank senior, unitranche, and second lien debt instruments by ~25 – 50 basis points for companies greater than $10 million in LTM EBITDA and greater than $40 million in LTM EBITDA.
It is important to reiterate that the pricing compression modifications to SPP’s May pricing metrics are the result of a “structural” modification to the traditional private demographic, not to be confused with “improving liquidity” conditions in the private market. Make no mistake, general private market liquidity conditions (i.e., credit spreads and leverage multiples) remain at their most conservative levels since the Great Recession in 2008. Due to this fact, many market professionals are sitting on the sidelines and “Waiting on the World to Change.”
The Private Market is Still in Risk-off Mode
Though both commercial banks and non-bank direct lenders have their own unique challenges to contend with, the clear and pervasive market sentiment is that we are in a decidedly “risk-off” market, and while there have been glimmers of macroeconomic strength (April U.S. manufacturing production up 1.0% vs. 0.01% expectation, April retail sales up 0.6% vs. 0.2% expectation), the consensus view is that a recession in late 2023 into early 2024 is still more likely than not. As noted by Evercore Chairman Ed Hyman in a May 16th Bloomberg interview,
“The economy now is very strong. It’s amazing. But I’m patient, and I think that by the summer, we’ll start to see a recession unfold.”
Hyman pointed to the contraction in the money supply stemming from recent banking failures as well as the inversion of the 2 – 10 treasury yield curve, which is a notoriously accurate predictor of a coming recession.
The New York Fed substantiates Hyman’s prediction, currently citing the likelihood of a recession by April 2024 at 68.22%. Investors, however, have much more immediate evidence to warrant their concerns about an economic downturn. Already, interest coverage ratios have declined substantially due to a combination of lower free cash flow generation and higher capital costs. As noted in a recent Lead Left article (Churchill Asset Management), “the average interest coverage ratio of 2.45x on new middle market sponsored deals in 1Q23 was well below the 3.07x posted a year earlier”. Loan repayment rates have also declined and are currently at their lowest level since 2008. With fixed charge coverage declining and Debt/EBITDA ratios climbing, it is no surprise that covenant breaches are on the rise as well. Recently published S&P Global Market Intelligence data shows U.S. large and middle market corporate defaults and bankruptcy filings remain elevated and, year-to-date, are at their highest level since 2010.
While all lending constituencies are impacted by the current macroeconomic environment, there are unique challenges facing each of the commercial bank and non-bank direct lending constituencies. Commercial banks continue to be under pressure since the volatility that led to the demise of Silicon Valley Bank (“SVB”) and Signature Bank. The Fed’s April 2023 Senior Loan Officer Opinion Survey on Bank Lending Practices provides a powerful illustration of the pressure on U.S. commercial banks, particularly smaller regional banks. As detailed in the survey, “Banks most frequently cited an expected deterioration in the credit quality of their loan portfolios and in customers’ collateral values, a reduction in risk tolerance, and concerns about bank funding costs, bank liquidity position, and deposit outflows as reasons for expecting to tighten lending standards over the rest of 23.”
Eerily consistent with SPP’s own published market commentary, the survey reported, “Over the first quarter, significant net shares of banks reported having tightened standards on C&I loans to firms of all sizes. Banks also reported having tightened all queried terms on C&I loans to firms of all sizes over the first quarter. Tightening was most widely reported for premiums charged on riskier loans, spreads of loan rates over the cost of funds, and costs of credit lines. In addition, significant net shares of banks reported having tightened the maximum size of credit lines, loan covenants, and collateralization requirements to firms of all sizes. The net fractions of banks tightening standards for C&I loans was higher for large banks compared with other banks. This reflects more widespread tightening reported among the mid-sized banks compared with either the largest banks or other banks. Mid-sized banks generally reported tightening both price and nonprice terms more frequently than the largest banks and other banks.”
Non-bank direct lenders, of course, have to deal with the same macroeconomic headwinds that commercial banks face, but increasingly, their largest impediment to attracting assets is simply ”sticker shock” (i.e., the customers’ effective cost of capital). As delineated in the Market-At-A-Glance above, middle market pricing ranges on average at SOFR +~7.00% – 8.00%; with SOFR currently at ~5.05%, that translates to a current cash floating rate of 12.00% – 13.00%, not exactly most issuers’ concept of “senior” debt. Though direct lenders can be more competitive than their commercial bank counterparts on amortization (typically 1.0% – 2.5% per annum vs. a commercial bank at 7.5% – 10.0%) and can generally structure more permissive covenants, the cost of this debt is simply prohibitive, limiting aggregate leverage and requiring more equity capital for LBOs.
What is an issuer to do given the prevailing winds in the private market?
Two strategies that jump out are:
- (i) Matching up lower-cost asset-based commercial bank facilities (~SOFR + 2.50%) with fixed-rate non-amortizing subordinated notes (~12%-15%) gives the issuer a blended down cost of capital and reduced amortization. This provides the best of both commercial bank and non-bank markets while opening a large, competitively priced SBIC lending constituency; and
- (ii) Seeking structured equity and preferred share structures; these instruments sit below the debt stack, have a PIK dividend (so not a drag on current cashflow), and are generally non-dilutive (unless attached to a warrant). While the cost of capital of these structures is not insignificant (~14% – 18% IRR), they can be prepaid (albeit at a premium) within 24 months and could act as a much-needed bridge to a more hospitable liquidity environment.
Viable alternatives for issuers “Waiting on the World to Change.”
Tone of the Market
Liquidity conditions in the private market for May continue to be exceedingly challenging. Though some recent economic indicators have been optimistic (retail sales, manufacturing), there remains a meaningful threat of recession in ‘23 going into ‘24 (68% according to the NY Fed), and both commercial banks and non-bank direct lenders continue to circle the wagons.
From a commercial bank perspective, continued pressure on the regional bank system (i.e., enhanced regulatory oversight, capital adequacy considerations, liquidity constraints, and depositary migration) has materially impacted credit spreads, leverage multiples, and maximum hold levels. Meanwhile, non-bank direct lender minimum return parameters (i.e., spreads over SOFR) make access to capital an increasingly expensive proposition, with average floating coupon rates ranging from ~12.0% – 13.5% (SOFR + 7.0% – 8.5%).
Increased capital costs and weaker trading conditions have put downward pressure on fixed charge coverage ratios, increasing the potential for covenant violations and payment defaults. Not surprisingly, capex and acquisition activity have stagnated as issuers weigh the benefits of expansion against increased leverage costs in the face of a recessionary macroeconomic backdrop. However, necessity is once again proving to be the mother of invention, and there are an increasing number of investors offering creative alternatives to traditional cash-pay debt and dilutive common equity securities, specifically structured equity and non-cash interest preferred securities, which can bridge borrowers through an otherwise draconian issuance environment.
Minimum Equity Contribution
Cash equity contributions have become the primary focus point for all leveraged buyouts in the private market. Almost regardless of the enterprise multiple, lenders are focused on a minimum 50% LTV (i.e., equity capitalization of 50%). More importantly, actual new cash in a deal should also constitute at least 75% of the aggregate equity account. For the foreseeable future, the days of 20% – 25% equity contributions are over. While lenders will certainly give credit to seller notes and rollover equity, the new cash equity quantum is the primary metric.
Equity Investment and Co-investment
Liquidity for both direct equity investments and co-investments continues to be robust in the new year, and in many cases, more competitive debt terms can be achieved where there is an opportunity for equity co-investment. Interest in independently sponsored deals continues to be strong as well, but investors will require that the independent sponsor has real skin in the game (i.e., a significant investment of their own above and beyond a roll-over of deal fees). Family offices remain the best source of straight common equity, and, continuing the trend established in 2020, credit opportunity funds, insurance companies, BDCs, and SBICs will actively pursue providing both debt and equity tranches.

Stefan Shaffer
Managing Partner and Principal
Stefan has over 30 years of experience in the private market includes hundreds of transactions in North America, Asia and Europe. Prior to becoming a principal at SPP Capital, Stefan was a Vice President in the Private Placement Group at Bankers Trust Company where he was responsible for origination, structuring and pricing of private placements for the Capital Markets Group, both nationally and internationally.
[email protected]
Ph: +1 212 455 4502