
Tone of the Private Debt Market
By November, it’s all about one thing…closing deals.
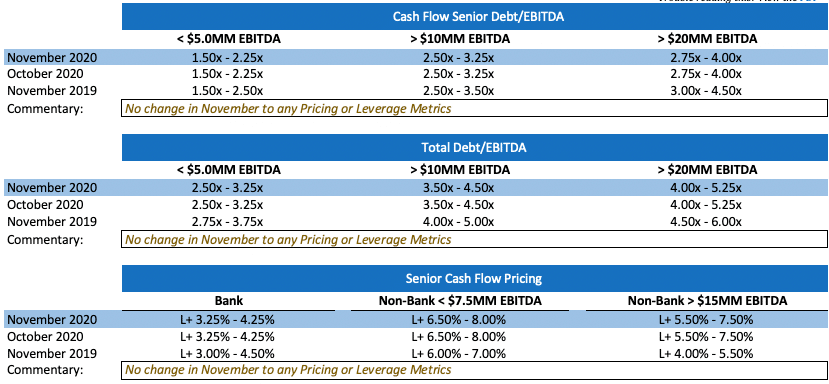
Even in a “normal” year, November is hurried and busy; given the pandemic and the resulting economic chaos it wreaked, this year has exacerbated the hurried and busy with the frantic and frenetic. Institutional investors are working overtime to process transactions, relegating many issuers, especially lower middle market and more storied credits, to the sidelines. From a quantitative perspective, we have not modified its pricing and leverage metrics for the month. From a qualitative perspective, however, unless you are already in front of lenders with comprehensive offering materials and a detailed financial model, the likelihood of a 2020 debt closing is marginal, at best.
As always, something of a “Deal Darwinism” phenomenon is at play this time of year where professionally managed offerings and strong operating issuers, supported by well-regarded sponsors, can still successfully enter, execute, and fund deals in 2020—in some cases, even entering the market until as late as the first week of December.
Minimum Equity Contribution
In the current environment, most lenders will not even consider funding into a thinly capitalized deal. While the debt market has not settled on specific base equity levels, as a general proposition, a minimum aggregate of 50% base level equity (inclusive of any rollover) is likely required for most deals, with at least 30% minimum new cash equity. Exceptions to the rule would be where leverage multiples are quite conservative (<2.5X LTM EBITDA) combined with a significant rollover of the prior owner.
Equity Investment and Co-Investment
There is still abundant liquidity for both equity investment and co-investment as well as robust support for independent sponsors, especially in the case where an independent has secured an LOI at “value” pricing. Many traditional control equity sponsors continue to seek out minority investment positions. While family offices still are the best source of straight common, a growing number of credit opportunity funds, insurance companies, BDC’s, and SBIC’s will look at both debt and equity combination deals.
While still not back to pre-COVID levels, M&A activity picked up considerably since August and continues to build. Whereas most deals during the pandemic were add-ons and tuck-ins for existing platforms (in most cases where discussions had been initiated prior to the crisis), the market is increasingly returning to more traditional dynamics with a more balanced blend of broad auctions and new platform activity.
Recapitalization Liquidity
While leveraged recaps can still be executed, a January 2021 closing date will certainly be received with greater enthusiasm given the current scarcity of time and resources to process deals in the system. Similarly, recaps combined with an otherwise accretive use of proceeds such as an acquisition or growth initiative will be more well-received. Smaller, unsponsored debt recaps are best shelved until next year. As a general proposition, however, liquidity for leveraged recapitalization remains abundant.
Story Receptivity
November and December are simply not the months to launch storied, marginalized, or otherwise credit-challenged transactions. While deals of this nature may require capital in the short term, be subject to onerous forbearance terms, or involve issuers in actual default, most traditional lenders simply do not have the time, capacity, or willingness to dig into a difficult credit story.
While the “distressed” lender constituency is a viable source of capital at all times, as a general proposition, the pricing, terms, and structures extracted by the distressed lending community lead them to be truly “lenders of the last resort” and avoided unless other more traditional forms of capital are simply not available. The MSLP program was enacted to address a certain subset of these debt borrowers—specifically, entities that were expressly impacted adversely by COVID—however, unless extended, it is destined to a rather ignominious sunset in December 2020, having only deployed less than $3 billion of the initial $600 billion set aside for Program earlier this year.
LIBOR Floors
LIBOR floors have become ubiquitous in the current market. At the height of the pandemic (and the nadir of U.S. Treasury rates), LIBOR floors of 1.00% were the norm. As a medium- and long-term U.S. Treasury rates have widened and a more traditional yield curve has emerged, LIBOR floors range anywhere from 0.50%-1.00% for banks deals and 1.00%-1.50% for non-bank direct lenders.
State of the Private Debt Market
We are keeping all leverage metrics and pricing schemes unchanged in November; suffice it to say that liquidity conditions are exceptional given the fact that almost every issuer has been impacted in some fashion by the pandemic and, not surprisingly, adversely for the overwhelming majority of issuers. The most recent reports on the pandemic released by the Centers for Disease Control and Prevention are among the most sobering; the U.S. has had 9,919,553 cases as of November 10th and is averaging more than 100,000 new cases in the previous seven days.
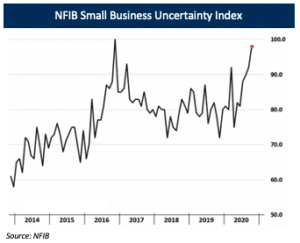 “Business Uncertainty” as reported in the most recent NFIB Small Business Uncertainty Index is at its highest level since 2016, roughly 10% higher than it was during the beginning of the pandemic in March. Yet, even with an increasing likelihood for new state-mandated shutdowns and global macroeconomic weakness, pricing is close to its pre-pandemic levels, and leverage metrics, while more conservative, are still at relatively competitive levels. In sum, pricing and leverage metrics have remained constant since September, and deals are being executed on a virtual basis at an unprecedented pace.
The focus of the market is squarely on one goal… closing by year-end. Deals that were deferred in Q2 and Q3, together with deals brought to market in Q4, are all vying for attention from investors, and the queue for closing is increasing daily. While there will always be those offerings that can move on an expedited basis regardless of circumstances (larger, strong operating companies, repeat issuers, and sponsors which are “house accounts” for the larger banks), most debt issuers will be hard-pressed by mid-November to launch and close a deal in 2020.
As noted in our previous Market Updates, however, there are a few proven strategies for Q4 issuances that can serve to expedite a timeline and still lock in a year-end closing. Among them:
- Get all NDAs completed well in advance of market entry. When timing is critical, time wasted negotiating the terms of a confidentiality agreement is a death knell for an expedited process. Getting the NDAs executed with selected lenders should be as primary a deal function as drafting a CIM;
- Have comprehensive offering materials (CIM, Detailed Financial Model, and Data Room) completed prior to issuance. No one wants information piecemeal; if an investor does not have a clear path to committee approval, it simply will not have priority;
- Limit distribution to a focused and select investor base; if an institution believes that it has a competitive advantage or preferred position to secure financing, it will likely prioritize submitting a bid. Similarly, if the timing is crucial, limit distribution to institutions capable of providing all the capital required;i.e. a unitranche provider versus a bifurcated senior/substructure, or a credit opportunity fund that can provide both debt and equity versus distinct debt and equity constituencies;
- Forego the new standard COVID-19 virtual roadshow with all interested groups; instead narrow the “most real” institutions to an expedited bake-off; i.e.–bring the two most interested/competitive proposals to meet management virtually. Broad-based virtual roadshows are a convenient and valuable source of providing maximum exposure to a management team, but they take time to coordinate, arrange, and execute; and
- While pricing and terms need to be aggressive, make timing the key determinant in choosing a financing partner. If closing by year-end is the single most essential element, focus all attention there—it should influence the term sheet you accept, the counsel you select, and terms you are prepared to live with.
The Macroeconomic Picture
Employment: More of the Same – In October, total non-farm payroll employment rose by 638 thousand, the sixth consecutive month with a rise in employment following April’s unprecedented labor market collapse. As to be expected, job gains are continually slowing from May through August average of 2.6 million job gains. The U-3 measure of unemployment (the official unemployment rate, which is the proportion of the civilian labor force that is unemployed but actively seeking employment) fell by 1.1% in October to 6.6%. Despite recent surges in COVID-19 cases, states have not yet reimplemented strict shutdowns to April levels, but are rather reverting to stricter social distancing policies, decreased capacity, and store hours for many establishments. The result is a much less impacted labor market than in April.
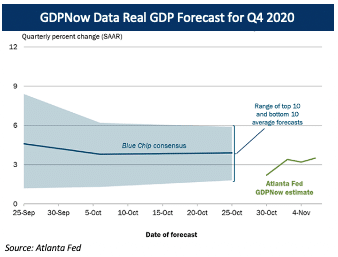 GDP: Back to Reality – After a 64.5% delta between Q2 and Q3 seasonally adjusted annual real GDP growth rates (-31.4% and 33.1%, respectively), Q4 finally offers some sense of normalcy. The Atlanta Fed’s GDPNow model for real GDP growth forecasts 3.5% growth in Q4 2020. Continued resumption of economic activity that had been curtailed due to COVID-19 will promote quarterly growth, but many economists believe that it will take until 2022 for economic output to return to prior year levels. For reference, the BEA estimates that seasonally adjusted real GDP (in chained 2012 dollars) was $19.3 trillion in Q4 2019, while it was $18.6 trillion in Q3 2020.
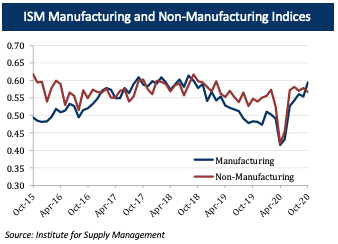 ISM Manufacturing and Services: (Manufacturing Upsurge) – ISM’s manufacturing index (the “PMI”) registered 59.3% in October, a 3.9% gain from September and an indication of overall economic expansion for the sixth consecutive month. Optimism is largely attributed to expanding output related to continually increasing proficiency with reconfigured factories. The non-manufacturing index (the “NMI”) registered 56.6% in October, a 1.2% decrease from September but still indicative of an expanding economy. October was the first month since August 2018 that the NMI has been surpassed by the PMI, which is due to uncertainty surrounding the pandemic, capacity constraints, logistics, and the elections. Many service businesses are still greatly reliant and subject to COVID restrictions, and state-imposed policies to counteract the current wave of COVID cases are still largely in question, leaving apprehension in the outlook of the services sector.
Consumer Confidence: Wait and See – The University of Michigan’s Consumer Sentiment Index posted 81.8 in October, approximately 7.7 index points above August’s figure and 1.4 index points above September’s. Fear surrounding rising COVID infections are the primary reason for the index continuing to travel well below its 2014 to 2019 average, and renewed optimism requires progress against COVID and its impacts to families and firms. In that respect, consumer sentiment for the month of November may rally with the result of the 2020 presidential election.
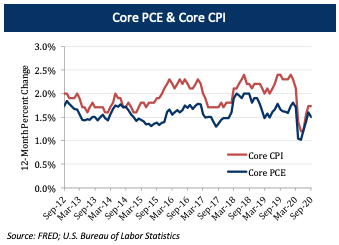 Inflation: Fed to Lend a Hand – The Core PCE price index, the Federal Reserve’s preferred measure of inflation, rose 0.2% month-over-month in September, slowing from a 0.3% gain in the prior month. Year-over-year, core PCE inflation has still maintained at 1.6%, well below the Fed-mandated 2.0% target rate. The Federal Open Market Committee stated that it would allow inflation to rise above 2% if that would ensure maximum employment, which aligns with the Fed’s new strategy to target a longer-run inflation goal of 2%. Previously, the inflation target was pursued on a rolling basis, but now the Fed will implement appropriate monetary policy to achieve inflation moderately above 2% following periods when inflation has been consistently below 2%, vice versa. Given October’s effective Federal Funds Rate of 0.09%, the Fed will turn to expansionary monetary policies such as increasing holdings of Treasury securities and agenting mortgage-backed securities at least at the current pace.
*Securities offered through SPP Capital Partners, LLC: 550 5th Ave., 12th Floor, New York, NY 10036. Member FINRA/SIPC.
If you have a current or prospective liquidity need, you may book a complimentary call with any of our 私人债务团队在这里.