
Stefan Shaffer shares the latest US Private Capital Report for April 2024. For the fifth consecutive month, we are reporting higher leverage multiples and lower credit spreads, highlighting a market shift. For middle-market issuers, liquidity conditions are both “Better and Worse,” presenting new opportunities amid the evolving landscape. Read the full report below.
Commercial Banks Marginalized in Cash Flow Lending
As we enter May, the private market landscape is transforming dramatically. Traditional commercial banks, once the bedrock of middle-market lending, are now sidelined in the cash flow lending arena. In stark contrast, private credit providers are seizing the reins, redefining liquidity conditions with their $1.7 trillion capital base, projected to surge beyond $3.1 trillion by 2027. This influx of non-bank lenders, coupled with their vast financial resources, is driving leverage and pricing metrics to unprecedented levels. For the fifth consecutive month, SPP has reported increased leverage multiples and reduced credit spreads, signaling a significant shift in market dynamics. For middle-market issuers, liquidity conditions are paradoxically both “Better and Worse”—offering new opportunities amid the evolving landscape.
SLOOS Report: Confirming the Trend
Earlier this month, the April 2024 Senior Loan Officer Opinion Survey on Bank Lending Practices (the “SLOOS” report) was released. For those of us in the market every day, the SLOOS report merely confirmed a trend omnipresent since March 2023, to wit, a prolonged withdrawal by commercial banks from middle market lending (especially cash flow loans) and a pronounced unwillingness to “stretch” on pricing and leverage to attract assets. In Fed parlance, that translates to:
“Over the first quarter, moderate net shares of banks reported having tightened standards on C&I loans to firms of all sizes4 Banks also reported having tightened all queried terms on C&I loans to firms of all sizes over the first quarter. Tightening was most widely reported for the maximum size of credit lines, the costs of credit lines, the spreads of loan rates over the cost of funds, and the premiums charged on riskier loans, for which moderate net shares of respondents reported having tightened these terms for loans to firms of all sizes. On balance, large banks reported leaving C&I lending standards and most terms basically unchanged, while most other banks reported having tightened C&I lending standards and terms for loans to firms of all sizes.”
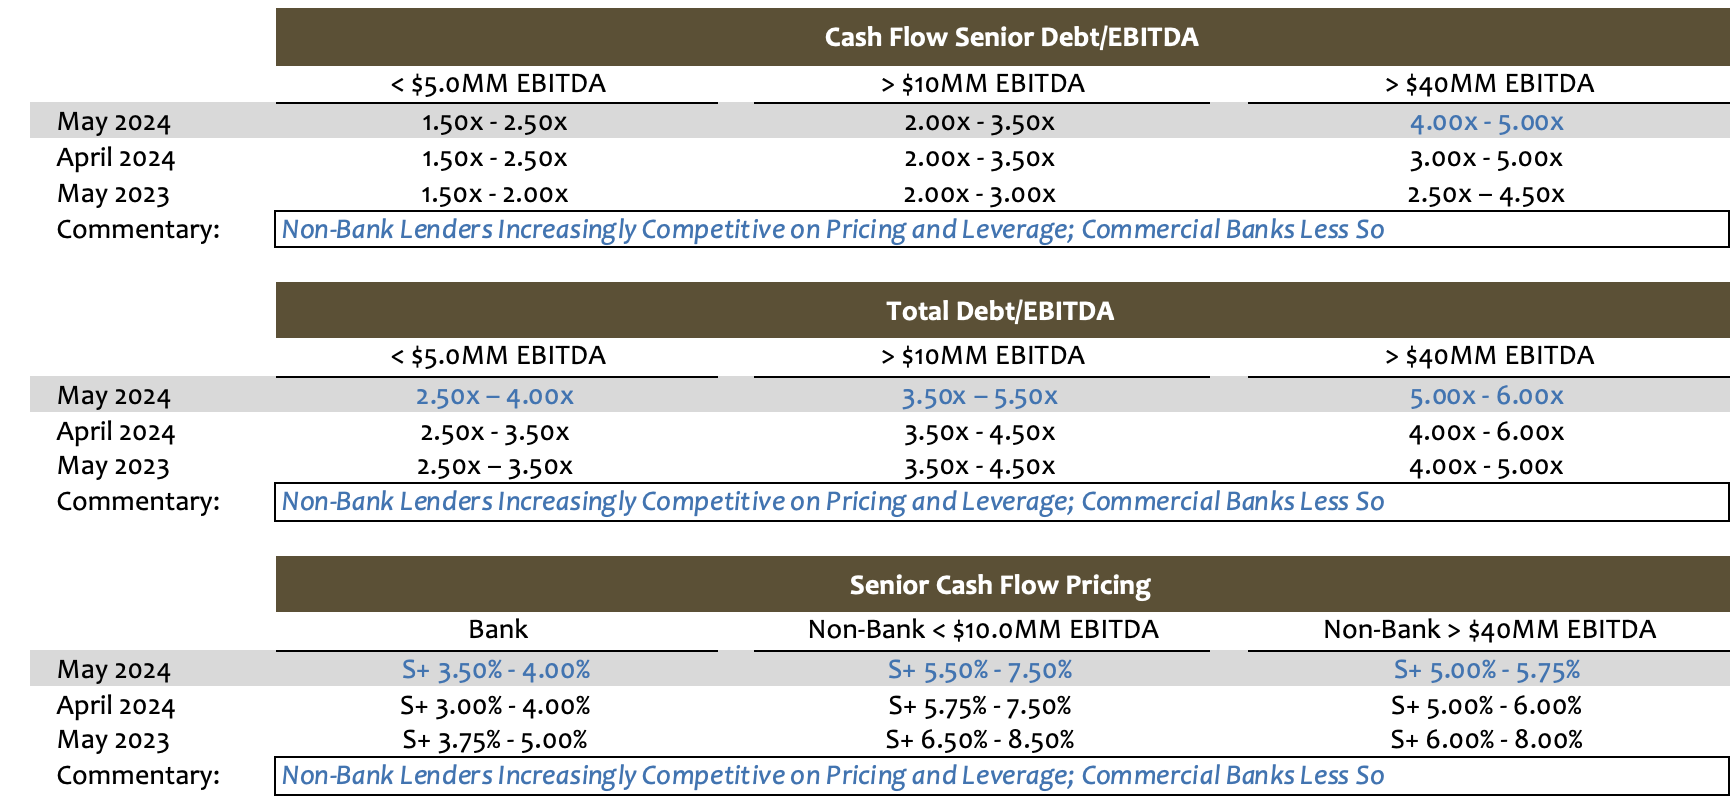
It should be noted that there are some bright spots in the latest SLOOS report, specifically that while a majority of respondents report tightening of credit standards, the pace of bank tightening has eased in the most recent quarter, i.e., fewer banks are tightening in Q1 of 2024 than in Q4 of 2023. Still, as a general proposition, for most middle-market cash flow issuers, commercials remain squarely in “risk-off” mode, with higher pricing (SOFR + 3.50% – 4.00%), lower leverage multiples (~1.75x – 2.50x Sr. Debt/LTM EBITDA), higher fixed amortization (~7.5% – 12.0% in year one and growing annually), and tighter covenant structures (Limitation of Maximum Senior Indebtedness/LTM EBITDA 3.0 – 3.5:1), and maintenance of EBITDA less capex to Fixed Charges (~1.25+:1).

The Rise of Non-Bank Direct Lenders
A recent headline in the Wall Street Journal highlighted the divergent paths of commercial banks and non-bank direct lenders: “Move Aside, Big Banks: Giant Funds Now Rule Wall Street – Giant Investment Companies are Taking Over the Financial System.” Hyperbole aside, the article details the growth of non-bank asset managers and their continuing growth and dominance of a variety of asset classes. As noted in the article,
“Top firms now control sums rivaling the economies of many large countries. They are pushing into new business areas, blurring the lines that define who does what on Wall Street and nudging once-dominant banks toward the sidelines. The growth spurt came out of the 2008 financial crisis, when new regulation curtailed investing and lending by banks, making room for fund managers to expand. Central banks kept interest rates low for most of the following decade, driving investors out of savings accounts and Treasury bonds and into managed funds. In 2008, U.S. banks and fund managers were roughly neck and neck at about $12 trillion of assets. Today, traditional asset managers, private-fund managers and hedge funds control about $43.5 trillion, nearly twice the banks’ $23 trillion, according to a Wall Street Journal analysis of data from the Federal Reserve, HFR, ICI, and Preqin.”
Good News for Issuers: Lower Pricing and Higher Leverage
The private debt segment of these portfolios is merely a fraction of the aggregate assets of these private asset managers, but it still constitutes ~$1.7 trillion of liquidity, and that liquidity translates into fierce demand for assets. Given the current high-rate environment and the improving but still lackluster M&A market, deal volumes remain on the light side in the private market, and that has created something of a mismatch between supply and demand, which in recent months has morphed into one of the most competitive markets in recent years. In the same way nature abhors a vacuum, and a market with excessive liquidity abhors a light deal calendar—and that means good news for issuers—lower pricing, higher leverage, increased DDTL commitments, and looser covenants. To put this in real deal terms, a hypothetical issuer with ~$15 million in LTM EBITDA with total leverage of 4.5x in a non-cyclical sector would likely have gleaned a senior term debt spread of SOFR + 6.50% in March of this year. That spread would be closer to SOFR + 6.00% in April, and if that same issuer came to the market in May, the spread would be closer to SOFR + 5.50%.
Taking Advantage of the Non-Bank Market
It should be noted that whether it be investment-grade bonds or high-yield 144A Notes, rates across the capital markets are more aggressive today than they were in the first quarter of the year, but the magnitude and velocity of the spread compression in the private market is seemingly unprecedented; issuers contemplating an offering in Q2 would be well advised to take advantage of the non-bank market. Of course, as a general proposition, SOFR + 3.50% bank financing may present a more compelling commercial alternative, but with that lower cost of capital comes a multitude of equally less compelling non-price limitations. In short, the private debt market is both “Better and Worse.”
Tone of the Market
The Private Market is beginning to take on a sort of “Tale of Two Cities” vibe this May. For issuers seeking non-bank direct loans, it is quickly becoming “the best of times” (or at least the best of times since 2021). While it is not necessarily “the worst of times” for issuers seeking lower-cost commercial bank financing, lending conditions have really not improved noticeably at all in 2024. In other words, while private credit lenders are solidly “risk-on,” commercial banks remain equally “risk-off.” If anything, as recently reported in the Fed’s Senior Loan Officer Opinion Survey on Bank Lending, commercial banks have tightened lending standards through Q1 of ’24. Notwithstanding the continued retreat from the banks, for the fifth consecutive month, SPP is expanding its leverage multiples and tightening credit spread guidance, driven almost exclusively by non-bank direct lenders. Notably, current “chatter” in the market suggests that non-bank direct lenders are prepared to get even more aggressive levels to attract deal flow in an increasingly competitive market. While pricing and leverage multiples are the most obvious examples of the divergent liquidity conditions between the bank and non-bank lending constituencies, non-bank lenders also offer the capacity to offer de minimus fixed amortization (1.00% – 2.50% per annum), increased committed delay draw facilities, and heightened covenant flexibility.
Minimum Equity Contribution
Cash equity contributions have become the primary focus point for all leveraged buyouts in the private market. Regardless of the enterprise multiple, lenders are focused on a minimum 50% LTV (i.e., equity capitalization of 50%). More importantly, actual new cash in a deal should also constitute at least 75% of the aggregate equity account. For the foreseeable future, the days of 20% – 25% equity contributions are over. While lenders will certainly give credit to seller notes and rollover equity, the new cash equity quantum is the primary metric.
Equity Investment and Co-Investment
Liquidity for both direct equity investments and co-investments continues to be robust in the new year, and in many cases, more competitive debt terms can be achieved where there is an opportunity for equity co-investment. Interest in independently sponsored deals continues to be strong as well, but investors will require that the independent sponsor has real skin in the game (i.e., a significant investment of their own above and beyond a roll-over of deal fees). Family offices remain the best source of straight common equity, and, continuing the trend established in 2020, credit opportunity funds, insurance companies, BDCs, and SBICs will actively pursue providing both debt and equity tranches.
*Securities offered through SPP Capital Partners, LLC: 550 5th Ave., 12th Floor, New York, NY 10036. Member FINRA/SIPC

Stefan Shaffer
Managing Partner and Principal
Stefan has over 30 years of experience in the private market includes hundreds of transactions in North America, Asia and Europe. Prior to becoming a principal at SPP Capital, Stefan was a Vice President in the Private Placement Group at Bankers Trust Company where he was responsible for origination, structuring and pricing of private placements for the Capital Markets Group, both nationally and internationally.
[email protected]
Ph: +1 212 455 4502