
Stefan Shaffer, our New York Partner shares the April 2021 Private Capital Report. Market conditions remain positive. The most significant drivers of the current liquidity situation are the massive growth in the non-bank direct lending constituency, a stronger banking system and healthier macro-economic metrics. Read the full report below.
Tone of the Private Capital Market
April private market liquidity conditions remain exceptionally robust and continue the trends established earlier in the year. Specifically, that translates into tighter pricing, greater leverage multiples, and a willingness for investors to accept increased adjustments to EBITDA and looser covenant restrictions; conditions not only “pre-pandemic” in scope, but seemingly as aggressive as they have since the halcyon days preceding the Great Recession.
Drivers for the excess liquidity include the increasing magnitude of the non-bank direct lending community ($900+ billion), a healthy commercial banking system (less hampered by historical FED, OCC, and FDIC leverage guidance), and renewed strength of the Business Development Company (“BDC”) community, whose public share prices have recovered from their deep discounts to Net Asset Value. Contributing to the already competitive market dynamics are larger funds dipping down to the lower middle market (sub-$15 million in LTM EBITDA) in search of product and bringing along with them the even more aggressive terms associated with the larger corporate leverage market.
State of the Private Market
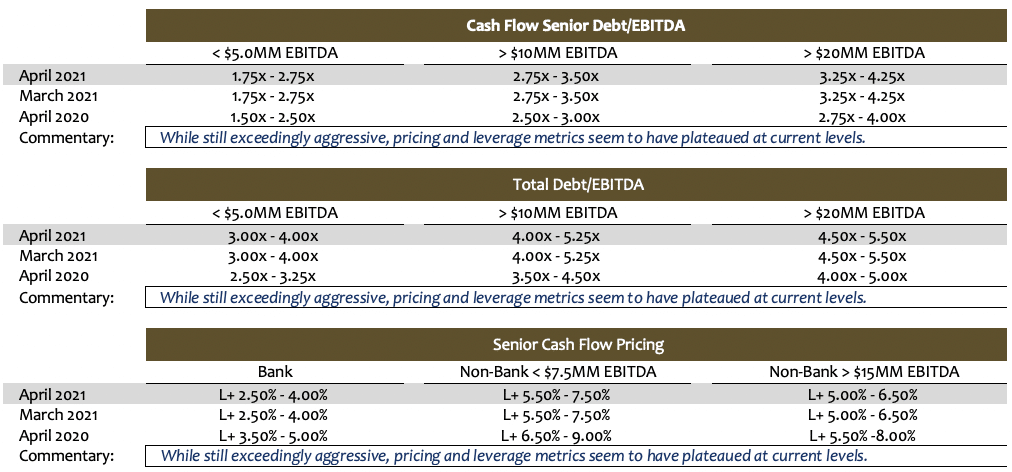
SPP is not making any modifications to its Market-At-A-Glance metrics for the month of April, following three consecutive months of tightening spreads and increasing leverage multiples. The market is still in a state excess liquidity but seems to either plateauing at current levels, or at least taking a breather before stretching to an even more aggressive position. Not only has the market recovered to pre-pandemic levels, but pricing and leverage metrics have returned to among the most competitive terms in the last 20 years.
All the secular influences that fueled this most recent surge in liquidity in Q1 are still very much in full force and effect, and recently, there are even more factors contributing to what may become the most aggressive market in the history of the private capital markets. As discussed in greater detail in the March Market Update, among the most significant drivers of the current liquidity situation are:
- The massive growth and sheer magnitude of the non-bank direct lending constituency ($900+ billion);
- A healthier and more robust commercial banking system (with little or no “toxic assets” on their balance sheets and, accordingly, a more forgiving and generous oversight by the OCC, Fed, and FDIC with respect to leverage lending guidance);
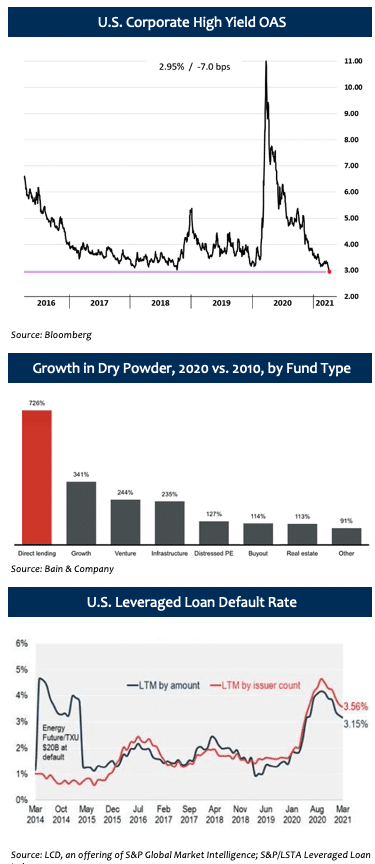
- Increasingly stronger macroeconomic metrics (non-farm payroll growth of 916,000 in March, Atlanta Fed’s GDPNow pointing to 6% GDP growth in Q1 2021, ISM Manufacturing up for its 10th consecutive month, and Consumer Confidence at its highest level since March of 2020); and
- Continued decreases in leveraged loan default rates (down ~34% since August 2020), portending a brighter credit upcycle in months to come.
 If that was not enough, two new influences have materialized in the lower middle market that have served to only stoke the liquidity furnace even more.
First, publicly traded Business Development Companies (“BDCs”), which were in large part sidelined from any meaningful market participation for much of the year in 2020 are not only back, but as liquid as they have been in years. Last year BDC share prices plummeted as result COVID-impacted businesses in many BDC portfolios. Specifically, during the height of COVID, BDC share prices to dropped to significant discounts from their net asset values (”NAV”), and even threatened their own liquidity, as banks to the BDC sector reduced or in some cases cut off access to credit facilities. Recently however, that situation has almost reversed itself. Of the 44 publicly traded BDCs, 43% are trading at or at a premium to their NAV, and 88.6% are trading at least 75% of their NAV. The average BDC is trading at 1.04x of NAV. Higher share prices translates to greater access to capital and liquidity, and ultimately to a more competitive constituency hunting for deals.
Second, the need for deal flow is driving some of the mega funds and credit investors from the larger and syndicated leverage lending markets to the lower middle markets, and when these larger players enter the lower middle market, they bring along the same large market credit dynamics that they experience in the larger corporate leveraged lending markets—specifically, “covenant-lite” deal structures, increased debt multiples, and tighter pricing. Kelly Thompson of Direct Lending Deals (“DLD”) recently noted, “It’s no exaggeration that covenant-lite is invading direct lending. Market participants across the board say today’s cutoff is $20 million EBITDA, compared to $35-40 million pre-COVID, and $50 million prior to the Great Credit Crisis of ‘08. Last week DLD covered a covenant-lite buyout financing for a borrower generating $22 million of EBITDA in the engineering and field services industry. Total leverage was 6.5x.”
With the addition of BDCs and the funds that normally participate in the large corporate leveraged markets, an already overheated middle market is likely to hit even more competitive metrics in coming months. Make no mistake, this is a risk-off issuer’s market; it is literally, The Best of Times.
A Quick Note on Recurring Revenue Loans
Why worry about positive EBITDA or commercial banks “3/4” leverage box? Just take a multiple of monthly recurring revenue (“MRR”) or annual recurring revenue (“ARR”) and get all the debt you need? Seems too good to be true… spoiler alert, it is. While there are an increasing number of lenders from both the commercial banking and non-bank direct lending constituencies providing between 1x to 2x+ multiples on ARR or 12x+ on MRR, recurring revenue loans are not the panacea for low EBITDA or EBITDA negative issuers.
ARR and MRR loans range in price from a L+2.00%-3.50% (commercial banks) and 5.00%-8.00% (non-bank direct lenders) and can prove to be a viable and competitive source of funding for fast growing companies that have a true recurring revenue base (i.e.-fixed contract revenue, not merely usage-based revenue), low churn, and a clear path to positive EBITDA within a well-defined period. They are also generally characterized by strong sponsorship that has invested significant capital to date. In essence, these facilities should really be considered almost “bridge facilities” to future profitability, upon which the more traditional metrics (Debt/EBITDA and Fix Charge Coverage ratios) replace the ARR and MRR multiple methodology. If an issuer, however, does fit these criteria, an ARR or MRR based loan may be the perfect answer for an issuer that lacks traditional positive EBITDA generation.
Minimum Equity Contribution
Most lenders remain wary of thinly capitalized deals, and as a general proposition, a minimum aggregate of 50% base level equity (inclusive of any rollover) is likely required for most deals, with at least 30%-35% minimum new cash equity. The market remains relatively tolerant of “structured-equity” solutions below the debt stack however, even supporting cash-pay (or cash/PIK) preferred structures between the debt and common shares.
Equity Investment and Co-Investment
Liquidity for both direct equity investment and co-investment continues unabated. Whereas opportunities for equity co-investment historically were limited by most traditional lenders or relegated to a small percentage of their aggregate debt commitment, interest in equity co-investment has boomed. In most cases, the ability to offer an equity co-investment (and the accompanying “upside” equity potential) will generate lower all-in borrowing costs, enhanced amortization flexibility, and more robust adjustments to EBITDA.
Interest in independently sponsored deals also continues unabated, especially in those cases where an independent has secured an LOI at “value” pricing. Family offices are still the best source of straight common equity, and, continuing the trend established in 2020, credit opportunity funds, insurance companies, BDCs, and SBICs will actively pursue providing both debt and equity tranches.

斯蒂芬·谢弗(Stefan Shaffer)
执行合伙人兼负责人
Stefan在私人市场拥有30多年的经验,包括在北美,亚洲和欧洲的数百笔交易。在成为SPP Capital的负责人之前,Stefan曾是Bankers Trust Company私人配售小组的副总裁,负责国内和国际资本市场集团私人配售的发起,结构设计和定价。
[email protected]
[email protected]
电话: +61 412 778 807