
State of the Private Market
As any capital markets professional will tell you, Q4 2021 is all about Hard Work. Deal flow has ballooned in 2021, and it looks like Q4 will be the busiest quarter of all. While reports of the level of deal flow volume are purely subjective at this juncture, Q4 volumes historically represent the largest volume of deal flow each year. That is only magnified this year, as the potential for an increase in the capital gains tax (from 23.8% to 43.3%), the current “excess liquidity” conditions, and the Federal Reserve’s indication of future interest rate hikes has the private market flooded with new deal flow.
Q4 2021 The Most Active Time in the History of the Private Market
M&A activity continues to be the largest source of new deal flow, followed by refinancing, debt recapitalizations, and other uses of proceeds. For the first three quarters of 2021, leveraged loan volume was ~$935 billion, complemented by another ~$389 billion of high yield bond volume. This puts leveraged lending on a path for a record volume year in 2021, aggregating ~$1.3 trillion in total leveraged financings (Refinitv LPC).
When deal flow continues at such a fierce pace and the finite amount of capital available for deployment is static, investors can afford to be more selective, ostensibly driving higher credit spreads and lower debt multiples. Like so many other things that confound conventional wisdom in 2021, that is simply not the case.
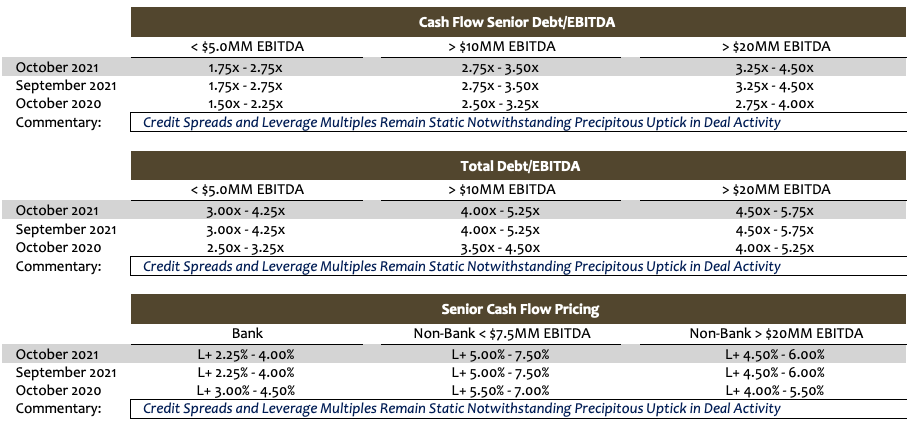
We are not making any changes to the market metrics in October after lowering spreads and increasing debt multiples more than eight times this year. In fact, for the beginning of Q4, arguably the most hectic and active time in the history of the private market, our metrics remain at their most competitive levels of the year. These metrics remain significantly below the levels recorded during the slowest month of the year, January. See the comparisons below for middle-market issuers with greater than $10 million in LTM EBITDA:
- CF Sr. Debt/EBITDA: 2.75X-3.50X (10/1/’21) vs. 2.50X-3.75X (1/1/’21)
- CF Total Debt/EBITDA: 4.00X-5.25X (10/1/’21) vs 3.50X-5.00X (1/1/’21)
- Sr. Bank Spreads: L+2.25%-4.00% (10/1/’21) vs L+3.25%-4.25% (1/1/’21)
- Sr. Non-Bank Spreads: L+5.0%-7.5% (10/1/’21) vs L+6.5%-8.0% (1/1/’21)
- Unitranche & 2nd Lien: L+6.0%-8.0% (10/1/’21) vs. L+6.5%-8.5% (1/1/’21)
2021 Is Still Very Much in an Economic Upcycle
This disconnect can be traced directly to the sheer magnitude of surplus capital available in the market. Even after record deployments of new cash in deals through Q3 2021, there is still a plethora of dry powder. According to Preqin, “Almost 60% of dry powder in direct lending is allocated to senior debt, with $103.9bn available for investment worldwide as of October 2021. The majority of this, $73.8bn, is with North America-based fund managers … North [which] have seen a huge increase in available capital over the past few years, with dry powder levels rising from $39.4bn at the end of 2019 to $65.6bn a year later, with the increase continuing in 2021.”
From a purely capital markets credit perspective, 2021 is still very much in an economic “upcycle,” reflecting continued economic recovery, the reopening of establishments, and government responses to the COVID-19 pandemic. Real GDP increased at an annual rate of 6.7 percent in the second quarter of 2021, and The Conference Board forecasts that U.S. Real GDP growth will moderate, but still grow at a robust 5.5 percent (annualized rate) in Q3 2021 with year-over-year annual growth at 5.9 percent for the full year. Additionally, loan default rates have significantly declined in recent months, approaching their lowest default rates in 12 years.
That combination of continued economic growth, low default rates, and record dry capital levels suggests that credit spreads and leverage multiples will remain aggressive through the remainder of the year, notwithstanding the abundance of new deal flow, and record M&A activity. In short, prepare yourself for some more Hard Work.
Tone of the Private Market
Deal activity normally peaks in the fourth quarter every year, and 2021 has been no exception. However, the magnitude of the peak in 2021 has been anything but normal. Market participants report that deal flow at present is as robust as it has ever been. While reports of a supercharged market are anecdotal right now, the empirical data recorded through Q3 firmly supports the proposition; leverage lending and high yield volume for the last nine-months topped $935 billion and $389 billion, respectfully, aggregating approximately $1.3 trillion in total leveraged financings.
Conventional wisdom would suggest that market conditions should tighten given the heightened deal calendar and the capacity for investors to be more selective in their choice of deals. However, liquidity conditions remain as aggressive as they were last month and even more aggressive than they were at the beginning of the year. The sheer abundance of capital available for deployment is simply too enormous to be adversely impacted by the uptick in deal activity. That will most likely change after the Thanksgiving holiday, when it is crunch time to close deals by year-end. At that point, it’s not really about deal flow, pricing, or leverage metrics, but whether there enough human resources available to process deals. Unless there are unique attributes available, (i.e., exceptionally strong credit profile combined with low leverage and better-than-market pricing), it will be unlikely to garner much attention in an otherwise preoccupied market.
Minimum Equity Contribution
Most lenders remain wary of thinly capitalized deals, and as a general proposition, a minimum aggregate of 50% base level equity (inclusive of any rollover) is likely required for most deals, with at least 30%-35% minimum new cash equity. The market remains relatively tolerant of “structured-equity” solutions below the debt stack however, even supporting cash-pay (or cash/PIK) preferred structures between the debt and common shares.
Equity Investment and Co-Investment
Liquidity for both direct equity investment and co-investment continues unabated. Whereas opportunities for equity co-investment historically were limited by most traditional lenders or relegated to a small percentage of their aggregate debt commitment, interest in equity co-investment has boomed. In most cases, the ability to offer an equity co-investment (and the accompanying “upside” equity potential) will generate lower all-in borrowing costs, enhanced amortization flexibility, and more robust adjustments to EBITDA. Interest in independently sponsored deals also continues unabated, especially in those cases where an independent has secured an LOI at “value” pricing. Family offices are still the best source of straight common equity, and, continuing the trend established in 2020, credit opportunity funds, insurance companies, BDCs, and SBICs will actively pursue providing both debt and equity tranches.
*Securities offered through SPP Capital Partners, LLC: 550 5th Ave., 12th Floor, New York, NY 10036. Member FINRA/SIPC

斯蒂芬·谢弗(Stefan Shaffer)
执行合伙人兼负责人
Stefan在私人市场拥有30多年的经验,包括在北美,亚洲和欧洲的数百笔交易。在成为SPP Capital的负责人之前,Stefan曾是Bankers Trust Company私人配售小组的副总裁,负责国内和国际资本市场集团私人配售的发起,结构设计和定价。
[email protected]
电话: +61 412 778 807